Washington — A record US$991.2 billion in illicit capital flowed out of developing and emerging economies in 2012--facilitating crime, corruption, and tax evasion--according to the latest study released today by Global Financial Integrity (GFI), a Washington, DC-based research and advisory organization. The study is the first GFI analysis to include estimates of illicit financial flows for 2012.
The report--GFI's 2014 annual global update on illicit financial flows--pegs cumulative illicit outflows from developing economies at US$6.6 trillion between 2003 and 2012, the latest year for which data is available. Titled "Illicit Financial Flows from Developing Countries: 2003-2012," the report finds that illicit outflows are growing at an inflation-adjusted 9.4 percent per year--roughly double global GDP growth over the same period.
"As this report demonstrates, illicit financial flows are the most damaging economic problem plaguing the world's developing and emerging economies," said GFI President Raymond Baker, a longtime authority on financial crime. "These outflows--already greater than the combined sum of all FDI and ODA flowing into these countries--are sapping roughly a trillion dollars per year from the world's poor and middle-income economies."
"Most troubling, however, is the fact that these outflows are growing at an alarming rate of 9.4 percent per year--twice as fast as global GDP," continued Mr. Baker. "It is simply impossible to achieve sustainable global development unless world leaders agree to address this issue head-on. That's why it is essential for the United Nations to include a specific target next year to halve all trade-related illicit flows by 2030 as part of post-2015 Sustainable Development Agenda."
Findings
Authored by GFI Chief Economist Dev Kar, and GFI Junior Economist Joseph Spanjers, the study reveals that illicit financial flows hit an historic high of US$991.2 billion in 2012--marking a dramatic increase from 2003, when illicit outflows totaled a mere US$297.4 billion. Over the span of the decade, the report finds that illicit financial flows are growing at an inflation-adjusted average rate of 9.4 percent per year. Still, in many parts of the world, the authors note that illicit flows are growing much faster--particularly in the Middle East and North Africa (MENA) and in Sub-Saharan Africa, where illicit flows are growing at an average annual inflation-adjusted rate of 24.2 and 13.2 percent, respectively.
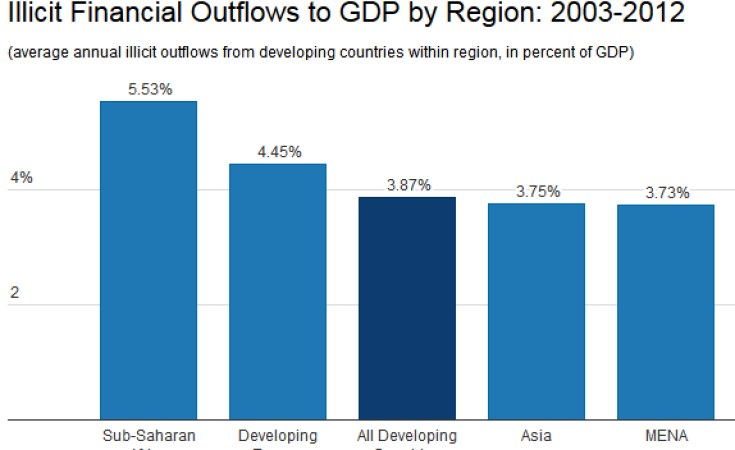
Totaling US$6.6 trillion over the entire decade, illicit financial flows averaged a staggering 3.9 percent of the developing world's GDP. As a share of its economy, Sub-Saharan Africa suffered the largest illicit financial outflows--averaging 5.5 percent of its GDP--followed by developing Europe (4.4 percent), Asia (3.7 percent), MENA (3.7 percent), and the Western Hemisphere (3.3 percent).
"It's extremely troubling to note just how fast illicit flows are growing," stated Dr. Kar, the principal author of the study. "Over the past decade, illicit outflows from developing countries increased by 9.4 percent each year in real terms, significantly outpacing economic growth. Moreover, these outflows are growing fastest in and taking the largest toll--as a share of GDP--on some of the poorest regions of the world. These findings underscore the urgency with which policymakers should address illicit financial flows."
Trade Misinvoicing Dominant Channel
The fraudulent misinvoicing of trade transactions was revealed to be the largest component of illicit financial flows from developing countries, accounting for 77.8 percent of all illicit flows--highlighting that any effort to significantly curtail illicit financial flows must address trade misinvoicing.
Major Global Development Implications
The US$991.2 billion that flowed illicitly out of developing countries in 2012 was greater than the combined total of foreign direct investment (FDI) and net official development assistance (ODA), which these economies received that year. Illicit outflows were roughly 1.3 times the US$789.4 billion in total FDI, and they were 11.1 times the US$89.7 billion in ODA that these economies received in 2012.
"Illicit financial flows have major consequences for developing economies," explained Mr. Spanjers, the report's co-author. "Emerging and developing countries hemorrhaged a trillion dollars from their economies in 2012 that could have been invested in local businesses, healthcare, education, or infrastructure. This is a trillion dollars that could have contributed to inclusive economic growth, legitimate private-sector job creation, and sound public budgets. Without concrete action addressing illicit outflows, the drain on the developing world is only going to grow larger."
Country Rankings
Dr. Kar and Mr. Spanjers' research tracks the amount of illegal capital flowing out of 151 different developing and emerging countries over the 10-year period from 2003 through 2012, and it ranks the countries by the volume of illicit outflows. According to the report, the 25 biggest exporters of illicit financial flows over the decade are:
1. China...................... US$125.24 billion average (US$1.25 trillion cumulative)
2. Russia................................ US$97.39 billion avg. (US$973.86 billion cum.)
3. Mexico............................... US$51.43 billion avg. (US$514.26 billion cum.)
4. India.................................. US$43.96 billion avg. (US$439.59 billion cum.)
5. Malaysia............................ US$39.49 billion avg. (US$394.87 billion cum.)
6. Saudi Arabia...................... US$30.86 billion avg. (US$308.62 billion cum.)
7. Brazil................................. US$21.71 billion avg. (US$217.10 billion cum.)
8. Indonesia........................... US$18.78 billion avg. (US$187.84 billion cum.)
9. Thailand............................. US$17.17 billion avg. (US$171.68 billion cum.)
10. Nigeria............................... US$15.75 billion avg. (US$157.46 billion cum.)
11. U.A.E.................................. US$13.53 billion avg. (US$135.30 billion cum.) 1
12. South Africa.......................... US$12.21 billion avg. (US$122.14 billion cum.)
13. Iraq....................................... US$11.14 billion avg. (US$89.10 billion cum.) 2
14. Costa Rica.............................. US$9.40 billion avg. (US$94.03 billion cum.)
15. Philippines............................. US$9.35 billion avg. (US$93.49 billion cum.)
16. Belarus................................... US$8.45 billion avg. (US$84.53 billion cum.)
17. Poland.................................... US$5.31 billion avg. (US$53.12 billion cum.)
18. Panama................................. US$4.85 billion avg. (US$48.48 billion cum.)
19. Serbia..................................... US$4.57 billion avg. (US$45.66 billion cum.)
20. Chile...................................... US$4.56 billion avg. (US$45.64 billion cum.)
21. Brunei.................................... US$4.30 billion avg. (US$34.40 billion cum.) 3
22. Syria....................................... US$3.77 billion avg. (US$37.68 billion cum.)
23. Egypt...................................... US$3.77 billion avg. (US$37.68 billion cum.)
24. Paraguay................................. US$3.70 billion avg. (US$36.97 billion cum.)
25. Venezuela................................ US$3.68 billion avg. (US$36.77 billion cum.)
For a complete ranking of average annual illicit financial outflows by country, please refer to Appendix Table 2 of the report on page 28. The rankings can also be downloded here [Excel | 15 KB].
GFI also found that the top exporters of illegal capital in 2012 were:
1. China......................................... US$249.57 billion
2. Russia........................................ US$122.86 billion
3. India.......................................... US$94.76 billion
4. Mexico....................................... US$59.66 billion
5. Malaysia ................................... US$48.93 billion
6. Saudi Arabia............................... US$46.53 billion
7. Thailand..................................... US$35.56 billion
8. Brazil.......................................... US$33.93 billion
9. South Africa.................................US$29.13 billion
10. Costa Rica................................... US$21.55 billion
11. Indonesia.................................... US$20.82 billion
12. United Arab Emirates.................... US$19.40 billion
13. Iraq............................................. US$14.65 billion
14. Belarus........................................ US$13.90 billion
15. Philippines................................... US$9.16 billion
16. Syria........................................... US$8.64 billion
17. Nigeria........................................ US$7.92 billion
18. Trinidad and Tobago..................... US$7.41 billion
19. Vietnam....................................... US$6.93 billion
20. Lithuania..................................... US$6.45 billion
21. Libya........................................... US$5.40 billion
22. Panama....................................... US$5.34 billion
23. Aruba........................................... US$5.29 billion
24. Egypt............................................ US$5.09 billion
25. Chile............................................. US$5.08 billion
An alphabetical listing of illicit financial outflows is available by year for each country in Appendix Table 3 on pg. 30 of the report, or it can be downloaded here [Excel | 37 KB].
Policy Recommendations
The report recommends that world leaders focus on curbing the opacity in the global financial system, which facilitates these outflows. Specifically, GFI maintains that:
Governments should establish public registries of meaningful beneficial ownership information on all legal entities;
Financial regulators should require that all banks in their country know the true beneficial owner(s) of any account opened in their financial institution;
Government authorities should adopt and fully implement all of the Financial Action Task Force's (FATF) anti-money laundering recommendations;
Regulators and law enforcement authorities should ensure that all of the anti-money laundering regulations, which are already on the books, are strongly enforced;
Policymakers should require multinational companies to publicly disclose their revenues, profits, losses, sales, taxes paid, subsidiaries, and staff levels on a country-by-country basis;
Sign up for free AllAfrica Newsletters
Get the latest in African news delivered straight to your inbox
All countries should actively participate in the worldwide movement towards the automatic exchange of tax information as endorsed by the OECD and the G20;
Trade transactions involving tax haven jurisdictions should be treated with the highest level of scrutiny by customs, tax, and law enforcement officials;
Governments should significantly boost their customs enforcement, by equipping and training officers to better detect intentional misinvoicing of trade transactions; and
The United Nations should adopt a clear and concise Sustainable Development Goal (SDG) to halve trade-related illicit financial flows by 2030 and similar language should be included in the outcome document of the Financing for Development Conference in July 2015.
Methodology
There are no methodological changes between this report and GFI's 2013 annual update. To conduct the study, Dr. Kar and Mr. Spanjers analyzed discrepancies in balance of payments data and direction of trade statistics (DOTS), as reported to the IMF, in order to detect flows of capital that are illegally earned, transferred, and/or utilized.
"The estimates provided by our methodology are extremely conservative as they do not include trade misinvoicing in services, same-invoice trade misinvoicing, hawala transactions, and dealings conducted in bulk cash," explained Dr. Kar, who served as a Senior Economist at the International Monetary Fund before joining GFI in January 2008. "This means that many forms of abusive transfer pricing by multinational corporations as well as much of the proceeds of drug trafficking, human smuggling, and other criminal activities, which are often settled in cash, are not included in these estimates."
Footnotes:
1. Illicit financial outflow estimates from the oil exporting nations of Saudi Arabia and the United Arab Emirates should be viewed with caution as they could be inflated due to opaque transactions with their nation's sovereign wealth funds. As such, these nations were omitted from Table F on page 13 of the report. For more information, consult Appendix Table 15 on page 77 of GFI's 2012 annual study, "Illicit Financial Flows from Developing Countries: 2001-2010."
2. Data for Iraq were unavailable in 2003-2004, thus the average illicit outflows of US$11.14 billion reflect only the years 2005-2012. Likewise, Iraq's cumulative outflows of US$89.10 billion are cumulative outflows for 2005 through 2012 only.
3. Data for Brunei were not available in 2010 and 2011, thus the average illicit outflows of US$4.30 billion reflect only the years 2003-2009 and 2012. Likewise, the cumulative outflows of US$42.99 billion for Brunei are cumulative outflows for 2003 through 2009 plus 2012 only.